linear regression The term “regression” and the methods used to investigate connections between two variables may have originated around 100 years ago. It was first developed in 1908 by Francis Galton, a well-known British biologist who was studying heredity. One of his observations was that children of tall parents are taller than normal, but not as tall as their parents.
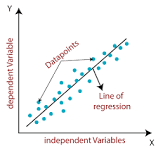
These statistical methods get their name from the “regression toward mediocrity”. The term regression and its evolution generally refer to statistical relationships between variables. In instance, simple regression is a regression approach used to investigate the relationship between one dependent variable (y) and one independent variable (x). The following traditional data collection provides information about the heights of both parents and children.
Table 1.1 Parent’s Height and Children’s Height
Parent 64.5 65.5 66.5 67.5 68.5 69.5 70.5 71.5 72.5
Children 65.8 66.7 67.2 67.6 68.2 68.9 69.5 69.9 72.2
The mean height is 68.44 for children and 68.5 for parents. The regression line for parent-child data is as follows: child height = 21.52 + 0.69 parent height. The simple linear regression model is commonly expressed as y = β0 + β1x + ε, where y is the dependent variable, β0 is the y intercept, β1 is the slope of the simple linear regression line, x is the independent variable, and ε is the random error.
The independent variable is referred to as an explanatory or predictive variable, whereas the dependent variable is also known as the response variable. An explanatory variable accounts for causal changes in the response variables. A regression model can be expressed as y = E(y) + ², with E(y) representing the response variable’s mathematical expectation. When E(y) is a linear combination.
If k equals one, the regression is simple linear regression. If E(y) is a nonlinear function of x1, x2, · ·, xk, the regression is nonlinear. The conventional assumptions for error terms are E(ε) = 0 and a constant variance Var(ε) = σ 2. In a simple linear regression experiment, we observe n pairs of data (x1, y1), (x2, y2), · · ·, (xn, yn) from a scientific experiment. The model can be written as yi = β0 + β1xi + εi for i = 1, 2, · · ·, n, with E(εi) = 0, a constant variance Var(εi) = σ 2, and all εi’s are independent. It’s worth noting that the actual value of σ 2 is frequently unknown.
The values of xi are measured “exactly”, with no measurement error. After specifying the model and collecting data, the next stage is to identify “good” estimates of β0 and β1 for the simple linear regression model that best fits the data from a scientific experiment. In the following part, we will generate and discuss these estimates’ statistical features.
2.2 linear regression -Least Squares Estimation.
The least squares principle for the simple linear regression model is to identify the estimators b0 and b1 such that the sum of the squared distance from
actual response yi and predicted response ˆyi = β0 + β1xi reaches the minimum among all possible choices of regression coefficients β0 and β1. i.e., (b0, b1) = arg min (β0,β1) Xn i=1 [yi − (β0 + β1xi)]2 . The least squares approach is designed to find parameter estimates by selecting the regression line that is the most “closest” to linear regression.
all data points (xi , yi). The least squares estimates of simple linear regression can be obtained mathematically by solving the following system: ∂ ∂β0 Xn i=1 [yi – (β0 + β1xi)].2 = 0 (2.1) ∂ ∂β1 Xn i=1 [yi – (β0 + β1xi)].2 = 0 (2.2) Assume that b0 and b1 are the solutions of the aforementioned system. We can characterize the link between system, we can describe the relationship between x and y by the regression line ˆy = b0 + b1x which is called the fitted regression line by convention.
It is more convenient to solve for b0 and b1 using the centralized linear model: yi = β ∗ 0 + β1(xi − x¯) + εi , where β0 = β ∗ 0 − β1x¯. We need to solve for ∂ ∂β∗ 0 Xn i=1 [yi − (β ∗ 0 + β1(xi − x¯))]2 = 0 ∂ ∂β1 Xn i=1 [yi − (β ∗ 0 + β1(xi − x¯))]2 = 0
Taking the partial derivatives with respect to β0 and β1 we have Xn i=1 [yi − (β ∗ 0 + β1(xi − x¯))] = 0 Xn i=1 [yi − (β ∗ 0 + β1(xi − x¯))](xi − x¯) = 0 Note that Xn i=1 yi = nβ∗ 0 + Xn i=1 β1(xi − x¯) = nβ∗ 0 (2.3) Thus, we obtain β ∗ 0 = 1 n Xn i=1 yi = ¯y. Substituting β ∗ 0 by ¯y in (2.3) we obtain Xn i=1 [yi − (¯y + β1(xi − x¯))](xi − x¯) = 0
linear regression Denote b0 and b1 be the solutions of the system (2.1) and (2.2). Now it is easy to see b1 = Pn i=1(yi − y¯)(xi − x¯) Pn i=1(xi − x¯) 2 = Sxy Sxx (2.4) and b0 = b ∗ 0 − b1x¯ = ¯y − b1x¯ (2.5) The fitted value of the simple linear regression is defined as ˆyi = b0 + b1xi .
The difference between yi and the fitted value ˆyi , ei = yi −yˆi , is referred to as the regression residual. Regression residuals play a crucial role in regression diagnosis, which we will cover in detail later. Regression residuals can be computed from the observed responses yi ’s and the fitted values ˆyi ’s, therefore, residuals are observable. It should be noted that the error term εi in the regression model is unobservable.

Thus, regression error is unobservable, whereas regression residual is observable. Regression error is the difference between an observation and its expected value, which is based on the entire population from which the statistical unit was randomly selected. The expected value, or average of the entire population, is often unobservable. Example 2.1: If the average height of a 21-year-old guy is 5 feet 9 inches and one randomly picked male is 5 feet 11 inches tall, the “error” is 2 inches. If the randomly chosen man is 5 feet 7 inches tall, the “error” is -2 inches.
It appears that the measuring of man’s height was an attempt to assess the population average, so that any variation between man’s height and An average would represent a measurement inaccuracy. In contrast, a residual is an observable estimate of unobservable error. The simplest scenario comprises a random sample of n men whose heights are measured. The sample average serves as an estimate of the population average. The gap between each man’s height and the unobservable population average is an error, but the difference between each man’s height and the observable sample average is a residual. Since residuals are observable, we can use them to estimate the unobservable model error.
2.3 linear regression Statistical Properties
Linear regression. Statistical Properties of Least Squares Estimation. In this part, we look at the statistical features of least squares estimates for basic linear regression. We will analyze statistical features without the distributional assumption on the error term. However, we will assume that E(²i) = 0, Var(²i) = σ 2, and ²i’s for i = 1, 2, · · ·, n are independent. Theorem 2.1: The least squares estimator b0 provides an unbiased estimate of β0. Proof. Eb0 = E(¯y − b1x¯) = E ³ 1 n Xn i=1 yi’ − Eb1x¯ = 1 n Xn i=1 Eyi − xEb ¯ 1 = 1 n Xn i=1 (β0 + β1xi) − β1x¯ = 1 n Xn i=1 β0 + β1 1 n Xn i=1 xi − β1x¯ Theorem 2.2: The least squares estimator b1 provides an unbiased estimate of
Eb0 = E(¯y − b1x¯) = E ³ 1 n Xn i=1 yi ´ − Eb1x¯ = 1 n Xn i=1 Eyi − xEb ¯ 1 = 1 n Xn i=1 (β0 + β1xi) − β1x¯ = 1 n Xn i=1 β0 + β1 1 n Xn i=1 xi − β1x¯ = β0. ¤ Theorem 2.2. The least squares estimator b1 is an unbiased estimate of β1. Proof. E(b1) = E ³Sxy Sxx ´ = 1 Sxx E 1 n Xn i=1 (yi − y¯)(xi − x¯) = 1 Sxx 1 n Xn i=1 (xi − x¯)Eyi = 1 Sxx 1 n Xn i=1 (xi − x¯)(β0 + β1xi) = 1 Sxx 1 n Xn i=1 (xi − x¯)β1xi = 1 Sxx 1 n Xn i=1 (xi − x¯)β1(xi − x¯) = 1 Sxx 1 n Xn i=1 (xi − x¯) 2β1 = Sxx Sxx β1 = β1
Theorem 2.3. linear regression Var(b1) = σ 2 nSxx . Proof. Var(b1) = Var³Sxy Sxx ´ = 1 S2 xx Var³ 1 n Xn i=1 (yi − y¯)(xi − x¯) ´ = 1 S2 xx Var³ 1 n Xn i=1 yi(xi − x¯) ´ = 1 S2 xx 1 n2 Xn i=1 (xi − x¯) 2Var(yi) = 1 S2 xx 1 n2 Xn i=1 (xi − x¯) 2σ 2 = σ 2 nSxx
Theorem 2.3.
llinear regression Var(b1) = σ 2 nSxx . Proof. Var(b1) = Var³Sxy Sxx ´ = 1 S2 xx Var³ 1 n Xn i=1 (yi − y¯)(xi − x¯) ´ = 1 S2 xx Var³ 1 n Xn i=1 yi(xi − x¯) ´ = 1 S2 xx 1 n2 Xn i=1 (xi − x¯) 2Var(yi) = 1 S2 xx 1 n2 Xn i=1 (xi − x¯) 2σ 2 = σ 2 nSxx
Theorem 2.4.
Linear regression. The least squares estimator b1 and y¯ are not associated. Using the normalcy assumption, yi for i = 1, 2, · · ·, n, b1 and y¯ are normally distributed and independent. Proof
Cov(b1, y¯) = Cov(Sxy Sxx , y¯) = 1 Sxx Cov(Sxy, y¯) = 1 nSxx Cov³Xn i=1 (xi − x¯)(yi − y¯), y¯ ´ = 1 nSxx Cov³Xn i=1 (xi − x¯)yi , y¯ ´ = 1 n2Sxx Cov³Xn i=1 (xi − x¯)yi , Xn i=1 yi ´ = 1 n2Sxx Xn i,j=1 (xi − x¯) Cov(yi , yj ) Note that Eεi = 0 and εi ’s are independent we can write Cov(yi , yj ) = E[ (yi − Eyi)(yj − Eyj ) ] = E(εi , εj ) = ( σ 2 , if i = j 0, if i 6= j
Theorem 2.5.
linear regression Var(b0) = ³ 1 n + x¯ 2 nSxx ´ σ 2 . Proof. Var(b0) = Var(¯y − b1x¯) = Var(¯y) + (¯x) 2Var(b1) = σ 2 n + ¯x 2 σ 2 nSxx = ³ 1 n + x¯ 2 nSxx ´ σ 2 ¤ The properties 1 − 5, especially the variances of b0 and b1, are important when we would like to draw statistical inference on the intercept and slope of the simple linear regression.
Since the variances of least squares estimators b0 and b1 involve the variance of the error term in the simple regression model. This error variance is unknown to us. Therefore, we need to estimate it. Now we discuss how to estimate the variance of the error term in the simple linear regression model. Let yi be the observed response variable, and ˆyi = b0 + b1xi , the fitted value of the response. Both yi and ˆyi are available to us.The true error σi in the model is not observable and we would like to estimate it.
The empirical version of the error εi is represented by the amount yi – yˆi. This difference is known as the regression residual, and it is significant in the diagnosis of regression models.We propose the following estimation of the error variance based on ei : s 2 = 1 n − 2 Xn i=1 (yi − yˆi) 2 Note that in the denominator is n−2. This makes s 2 an unbiased estimator of the error variance σ 2 .
The simple linear model contains two parameters, therefore n – 2 can be interpreted as the number of parameters in a simple linear regression model. We will see in subsequent chapters that this is true for all general linear models. In a multiple linear regression model with p parameters, the denominator should be n – p to create an unbiased estimator of the error variance σ2. Later chapters have more in-depth discussions
The unbiasness of estimator s 2 for the simple linear regression can be shown in the following derivations. yi − yˆi = yi − b0 − b1xi = yi − (¯y − b1x¯) − b1xi = (yi − y¯) − b1(xi − x¯) It follows that Xn i=1 (yi − yˆi) = Xn i=1 (yi − y¯) − b1 Xn i=1 (xi − x¯) = 0. Note that (yi − yˆi)xi = [(yi − y¯) − b1(xi − x¯)]xi , hence we have Xn i=1 (yi − yˆi)xi = Xn i=1 [(yi − y¯) − b1(xi − x¯)]xi = Xn i=1 [(yi − y¯) − b1(xi − x¯)](xi − x¯) = Xn i=1 (yi − y¯)(xi − x¯) − b1 Xn i=1 (xi − x¯) 2 = n(Sxy − b1Sxx) = n ³ Sxy − Sxy Sxx Sxx´ = 0
To show that s 2 is an unbiased estimate of the error variance, first we note that (yi − yˆi) 2 = [(yi − y¯) − b1(xi − x¯)]2 , therefore, Xn i=1 (yi − yˆi) 2 = Xn i=1 [(yi − y¯) − b1(xi − x¯)]2 = Xn i=1 (yi − y¯) 2 − 2b1 Xn i=1 (xi − x¯)(yi − y¯i) + b 2 1 Xn i=1 (xi − x¯) 2 = Xn i=1 (yi − y¯) 2 − 2nb1Sxy + nb2 1Sxx = Xn i=1 (yi − y¯) 2 − 2n Sxy Sxx Sxy + n S 2 xy S2 xx Sxx = Xn i=1 (yi − y¯) 2 − n S 2 xy Sxx

Since (yi − y¯) 2 = [β1(xi − x¯) + (εi − ε¯)]2 and (yi − y¯) 2 = β 2 1 (xi − x¯) 2 + (εi − ε¯) 2 + 2β1(xi − x¯)(εi − ε¯), therefore, E(yi − y¯) 2 = β 2 1 (xi − x¯) 2 + E(εi − ε¯) 2 = β 2 1 (xi − x¯) 2 + n − 1 n σ 2 , and Xn i=1 E(yi − y¯) 2 = nβ2 1Sxx + Xn i=1 n − 1 n σ 2 = nβ2 1Sxx + (n − 1)σ 2 .
Furthermore, we obtain E(Sxy) = E ³ 1 n Xn i=1 (xi – x¯)(yi – y¯)’= 1 n E Xn i=1 (xi – x¯)yi = 1 n. E Xn i=1 (xi − x¯)yi = 1 n Xn i=1 (xi − x¯)Eyi = 1 n Xn i=1 (xi − x¯)(β0 + β1xi) = 1 n β1 Xn i=1 (xi − x¯)xi = 1 n β1 Xn i=1 (xi − x¯) 2 = β1Sxx and Var³ Sxy´ = Var³ 1 n Xn i=1 (xi − x¯)yi ´ = 1 n2 Xn i=1 (xi − x¯) 2Var(yi) = 1 n Sxxσ 2 Thus, we can write E(S 2 xy) = Var(Sxy) + [E(Sxy)]2 = 1 n Sxxσ 2 + β 2 1S 2 xx and E ³nS2 xy Sxx ´ = σ 2 + nβ2 1Sxx.
After obtaining b1 and b0, the MLEs of the parameters β0 and b1, we may compute the fitted value ˆyi and the likelihood function using the fitted values. L = Yn i=1 f(yi) = 1 (2π) n/2σ n e (−1/2σ 2) Pn i=1 (yi – yˆi) 2 We then set the partial derivative with respect to σ 2 in the log likelihood function log(L) to zero. ∂ log(L) ∂σ2 = -n 2σ 2 + 1 2σ 4 Xn i = 1 (yi – yˆi) 2 = 0 The MLE for σ 2 is ˆσ 2 = 1 n Xn i=1 (yi – yˆi) 2.
Note that it is a skewed estimate of σ 2. We know that s 2 = 1 n − 2 Xn i=1 (yi − yˆi). 2 represents an unbiased estimate of the error.variance σ 2 . n n − 2 σˆ 2 is an unbiased estimate of σ 2 . Note also that the ˆσ 2 is an asymptotically unbiased estimate of σ 2 , which coincides with the classical theory of MLE.
2.5 Confidence Interval on Regression Mean and Regression Prediction Regression models are often constructed based on certain conditions that must be verified for the model to fit the data well, and to be able to accurately forecast the response to a given regressor. One of the primary goals of regression analysis is to use the fitted regression model to make predictions. Regression prediction is the computed response value from the fitted regression model for a data point that was not used in the model fitting. The confidence interval of the regression prediction allows you to measure the prediction’s quality.
Frequently the following regression prediction confidence intervals are of relevance. • A confidence interval for a single point on the regression line. • A confidence interval for a single future value of y that corresponds to a specific value of x. • A confidence interval for a single future value of y corresponding to a chosen value of x. • A confidence region for the regression line as a whole linear regression
Finally, E(ˆσ 2 ) is given by: E Xn i=1 (yi − yˆ) 2 = nβ2 1Sxx + (n − 1)σ 2 − nβ2 1Sxx − σ 2 = (n − 2)σ 2 . In other words, we prove that E(s 2 ) = E Ã 1 n − 2 Xn i=1 (yi − yˆ) 2 ! = σ 2 . Thus, s 2 , the estimation of the error variance, is an unbiased estimator of the error
variance σ 2 in the simple linear regression. Another reason for picking n – 2 is that in a simple linear regression model, there are n observations with two restrictions: (1) Xn i=1 (yi – yˆ) = 0; (2) Xn i=1 (yi – yˆ)xi = 0. Therefore, the error variance estimation has n – 2 degrees of freedom, which is also the number of total observations – total number of parameters in the model. We’ll find a similar feature in multiple linear regression. 2.4 Maximum Likelihood Estimation.
The maximum likelihood estimates of the basic linear regression can be developed if we assume that the dependent variable, yi, has a normal distribution.: yi ∼ N(β0 + β1xi , σ2 ). The likelihood function for (y1, y2, · · · , yn) is given by L = Yn i=1 f(yi) = 1 (2π) n/2σ n e (−1/2σ 2 ) Pn i=1(yi−β0−β1xi) 2 . The estimators of β0 and β1 that maximize the likelihood function L are similar to the estimators that minimize the exponential part of the likelihood function. This results in the same estimators as the least squares estimators of linear regression. The MLEs and least squares estimators for β0 and β1 are identical when the error term is assumed to be normal.
If a particular value of predictor variable is of special importance linear regression , A confidence interval of interest can be used to assess the precision of a single future value of y at a certain value of regressor x. The confidence interval estimator for a future value of y gives an interval for an expected value of y at x with a desired confidence level of 1 – α. It would be interesting to compare the two types of confidence intervals mentioned above.
The second kind has a broader confidence interval, which represents the lower precision caused by estimating a single future value of y rather than the mean value estimated for the first kind confidence interval. When the whole regression line is of relevance, a confidence area can provide concurrent statements regarding estimates of y for a variety of values of i.e.,
for a set of values of the regressor the 100(1 − α) percent of the corresponding response values will be in this interval. To discuss the confidence interval for regression line we consider the fitted value of the regression line at x = x0,
which is ˆy(x0) = b0 + b1x0 and the mean value at x = x0 is E(ˆy|x0) = β0 + β1×0. Note that b1 is independent of ¯y we have Var(ˆy(x0)) = Var(b0 + b1x0) = Var(¯y − b1(x0 − x¯)) = Var(¯y) + (x0 − x¯) 2Var(b1) = 1 n σ 2 + (x0 − x¯) 2 1 Sxx σ 2 = σ 2 h 1 n + (x0 − x¯) 2 Sxx i Replacing σ by s, the standard error of the regression prediction at x0 is given by syˆ(x0) = s s 1 n + (x0 − x¯) 2 Sxx If ε ∼ N(0, σ2 ) the (1 − α) of linear regression
1 thought on “Linear Regression-Mathematical Intuition For beginners A Machine learning Model”