Machine Learning-R-squared (R²)
It calculates the proportion of the variation in your dependent variable that can be explained by all of the independent variables in the model. It is assumed that each independent variable in the model contributes to explaining variation in the dependent variable.
In reality, certain independent factors (predictors) are insufficient to explain the dependent (target) variable. In other words, some variables do not help forecast the target variable.
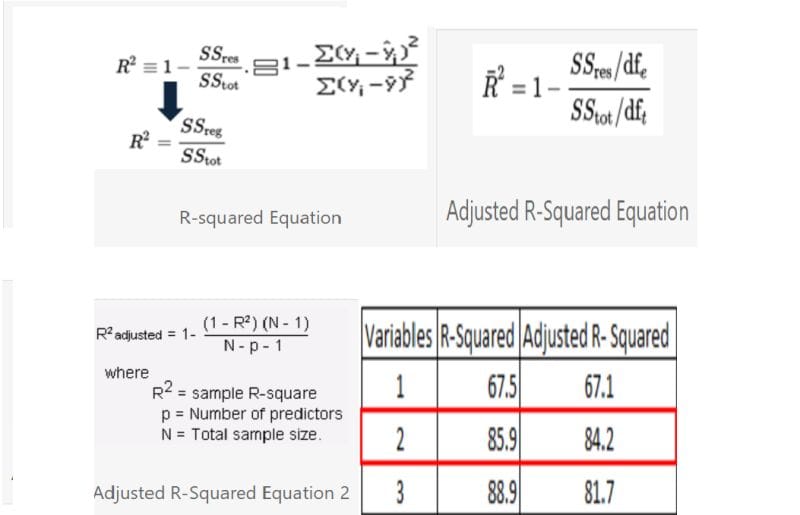
In mathematics, R-squared is determined by dividing the sum of squares of residuals (SSres) by the total sum of squares (SStot) and subtracting it from 1.
In this situation, SStot measures the overall variation. SSreg measures explained variance, while SSres measures unexplained variation.
Since SSres + SSreg = SStot, R² represents explained variation / total variation.
Machine Learning-Adjusted R-Squared
It calculates the fraction of variation explained by only the independent variables that are most useful in explaining the dependent variable. It penalizes you for using independent variables that do not help predict the dependent variable in regression analysis.
Adjusted R-Square can be expressed mathematically as a sum of squares. The sole difference between the R-square and Adjusted R-squares equations is the degree of freedom.
In the equation below, dft represents the degrees of freedom (n-1) of the estimate of the dependent variable’s population variance, and dfe represents the degrees of freedom (n-p-1) of the estimate of the underlying population error variance.
The adjusted R-squared value can be determined using the value of r-squared, the number of independent variables (predictors), and the total sample size.
Difference between R-square and Adjusted R-square
Machine Learning Even if the independent variable is negligible, adding it to a model causes the R-squared to grow. It never declines. Adjusted R-square increases only when the independent variable is significant and influences the dependent variable.
When two variables are included, the adjusted r-square value is at its highest. It decreases when a third variable is introduced.
When we incorporate the third variable, the r-square value increases. It indicates that the third variable is unimportant in the model.
R-Square versus Adjusted R-Square.
Adjusted r-square can be negative when r-square is near zero.
The adjusted r-square value is always less than or equal to the original r-squared value.
Machine Learning-Which is better?
Machine Learning– When comparing models with various numbers of independent variables, use adjusted R-squared. When selecting key predictors (independent variables) for a regression model, consider adjusted R-squared.
Adjusting Precision and Recall
Typically, there is a trade-off between precision and recall:
- Threshold Tuning:
- If you increase the threshold (the probability at which a positive classification is made), you might increase precision at the cost of recall.
- If you lower the threshold, recall increases, but precision might suffer.
- Cross-Validation and Model Selection:
- To get the best precision-recall balance, you can experiment with different machine learning models (e.g., logistic regression, decision trees) and use cross-validation to find the best one for your dataset.
- Precision-Recall Curve:
- Visualizing the precision-recall curve can help you determine the optimal threshold based on how important each metric is for your application.
A Detailed Overview on R-squared and Adjusted R-squared in Regression Analysis
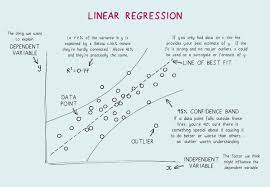
Regression analysis is a very strong statistical tool that underlies many data-driven decisions across industries. At its core, regression aims to model the relationship between one or more independent variables (predictors) and a dependent variable (outcome). Two key metrics that help evaluate the quality and effectiveness of regression models are R-square and adjusted R-square.
These metrics offer crucial insights into how well the independent variables explain the variability in the dependent variable.
We have decided to present an in-depth guide by discussing the definitions, equations and formulas for computing R-square and adjusted R-squared together, describing examples on their use in practice in certain industries, clarifying general and specific misconceptions, but above all providing real-case scenario examples to get a precise idea of the metrics on our focus.
Revisit the Basics: What’s R-squared?
R-square, also known as coefficient of determination, is a metric that analyzes how much of the variance of dependent variables is explained by independent variables’-squared varies between 0 to 1 and greater values are utilized to indicate a good fit.
For example, if, in a house price regression model based on square footage, the R-square value is 0.90, this can be interpreted to mean that 90% of house prices variation is accounted for through square footage, leaving 10% to factors that may have been excluded in the modeling or as natural randomness.
R-squared interpretation
R-square values are typically interpreted to express
• Less than 0.0 – 0.3 fit; predictors explain very small variates for the outcome.
• 0.3-0.6: Fit is adequate; model captures part of the variability but has enough headroom for further development.
• Between 0.6 and 1.0: Good fit; predictors explain much of the variation.
But that interpretation is naturally context dependent. If the discipline in question is physics or engineering, a high R-square is precisely what is expected because relationships among variables are deterministic.
If the discipline is social science or economics, then a lower R-square value is often tolerated simply because human behavior is so wonderfully complex and so sensitive to many unpredictable factors.
The Formula Behind R-square
The R-square is calculated through the formula:
R2=1− residualSStotalR2 = 1 – residual/total
Where:
•residual: The sum of squared discrepancies between observed and expected values; also known as unexplained variance.
• This is the total sum of squared differences between observed values and their mean, total variance.
The closer is to zero, the larger the R-square value will be, meaning that its prediction is very close to actual data.
What R-square Doesn’t Tell You
Although R-squared is an important metric, it has significant limitations:

1. It does not indicate causation: A high R-squared value only shows that there is correlation, not causation. For example, if there exists a strong relationship between ice cream sales and drowning incidents, then it doesn’t mean one causes the other, but perhaps both are affected by a third factor, like hot weather.
2. It does not measure the accuracy of prediction. R-square measures how well the model fits the data used in training, but it does not guarantee accurate predictions on other data.
3. Can be misleading when there are multiple predictors : adding more independent variables to a model will always increase R-square , but they may not be very relevant.
Adjusted R-squared: the new better option
Analysts utilize adjusted R-square to address some of R-square’s limitations.It adjusts the value of R-square for the number of predictors in the model.
Adjusted R-square penalizes the addition of irrelevant predictors and only lets meaningful variables contribute to the model’s explanatory power, unlike R-squared.
The Formula for Adjusted R-square
Adjusted R-squared is given by the expression:
Adjusted R2=1−(1−R2)n−1n−k−1Adjusted R2 = 1 – (1 – R2)frac{n – 1}{n – k – 1}Adjusted R2=1−(1−R2)n−k−1n−1
Where:
•Number of observations in the data.
• how many independent variables are in the model.
If the new predictor improves a model’s fit, then adjusted R-square will increase; otherwise, it will decrease if the new predictor adds little to the model.
Key Advantages of Adjusted R-square
1. Avoid Overfitting: Adjusted R-squared penalizes unnecessary complexity thus avoiding overfitting.
2. Facilitates Model Comparison: It is particularly useful for comparing models with different numbers of predictors, helping analysts identify the most parsimonious model.
3. Reflects Quality of the True Model: It holds a count of predictors for estimating a better fit of generalizing how well the model could approximate new data.
Practical Applications Across Industries
R-squared and adjusted R-squared are used in so many fields that enable data-driven insights for better decision-making. A few examples are as follows:
1. Marketing Analytics
Application Regression analysis can be applied to evaluate an advertising campaign’s effectiveness in a practical marketing setting. A firm could develop a model on the basis of the information of sales data plus advertising spend, social media activity, and email promotions. The value of R-squared is calculated and included in the report. However, adjusted R-squared only includes significant predictors added to this model.
2. Financial Projections
Often, financial analysts forecast the stock prices or the overall economic trends using regression models. For instance, with regression models, the stock price can be forecast based on interest rates, inflation rates, and market sentiment. Ensuring that only relevant predictors are included in order not to have the model influence by irrelevant economic indicators the adjusted R-squared helps.
3. Healthcare research
In healthcare, regression analysis is used to identify risk factors for diseases and assess treatment outcomes.
For example, a study might analyze how age, diet, and exercise impact cholesterol levels. Adjusted R-squared ensures that only significant lifestyle factors are considered, improving the model’s reliability.
4. Real Estate Valuation
In real estate, regression models predict the value of property based on features such as square footage, location, and amenities. Adjusted R-squared helps real estate professionals to build accurate models without overfitting the data.
Common Misconceptions and Best Practices
Misconception 1: A high R-squared always means a good model
A high R-squared may be an indicator of overfitting if the model includes irrelevant predictors. Always view adjusted R-squared and use additional diagnostics like residual plots to justify model performance.
Misconception 2 : Low R-squared indicates a poor model.
Sometimes, low R-squared is tolerable. For example, when one conducts a study involving human behavior, the degree of variability makes it almost impossible to achieve a high R-squared.
Misconception 3: All Variance-Ratio Adjusted R-squared Penalize Adding Variables

Adjusted R-squared: It will decrease only if the added variable does not improve the performance of the model. Meaningful contribution is rewarded and irrelevant one penalized.
Best practices using R-squared and adjusted R-squared
1. Use in Context: Interpret these metrics in the context of your data and research objectives.
2. Combining with Other Metrics Use it in conjunction with other evaluation metrics, such as the RMSE and AIC metrics.
3. Avoid Overfitting: Focus on building parsimonious models that balance complexity and accuracy.
R-squared and Adjusted R-squared in Machine Learning
These metrics are widely used in machine learning to evaluate regression-based algorithms like linear regression, ridge regression, and lasso regression. For instance, if one tries to predict the CLV of a customer, R-squared helps measure the overall fit, whereas adjusted R-squared ensures that the model remains interpretable and does not overfit.
Final Thoughts: The Legacy of R-squared and Adjusted R-squared in Analytical Excellence
In the fast-changing world of data science, some metrics stand as timeless pillars of effective analysis. Even though R-squared and adjusted R-squared are possibly the most well-established statistical concepts, they are still highly relevant today in modem analytics. They truly epitomize the very meaning of understanding relationships within data: simplicity, clarity, and actionable insight.
These metrics are more than mathematical conveniences; they represent a philosophy of model evaluation. R-squared speaks to how well we might be able to explain variability in outcomes, and adjusted R-squared reminds us about the cost of complexity. They speak to a balanced view by which one might evaluate quality and reliability in regression models.
The important broader context: Why these metrics matter
The value of R-squared and adjusted R-squared goes beyond the academic and theoretical bounds. Their ripples can be felt industries and disciplines over as affecting decisions that shape markets and policies, even lives and death. For instance, in health-related research, such metrics help decide potentially life-saving research by pointing out critical risk factors and the effectiveness of interventions, for example. In business, the metrics help organizations optimize processes, understand customer behavior better, and make accurate trend predictions.
This is not a statistical rule, but a universally applicable principle in solving any problem. It’s in an overwhelming world of data, when complexity masquerades as sophistication, that R-squared and adjusted R-squared remind one to focus on what’s important: actionable, interpretable insights.
Accept the ambiguity of interpretation.
The simplicity of these variables notwithstanding, interpretation necessarily requires nuances and context in which to make sense. A high R-squared actually may only be a pointer to variable strength and is not sure to relate this to predictive power or the causal chain. Low R-squared does nothing to weaken a model based on intrinsic high variability even in such domains.
Adjusted R-squared further complicates this picture because it introduces a penalty based on complexity. Although this is an adjustment that makes the metric more robust, in doing so, it also reminds analysts to be aware of where simplicity and explanatory power trade-offs are being made. These caveats underscore the importance of domain knowledge and critical thinking in analytical practice.
The Human Element: Beyond Metrics and Models
At its heart, regression analysis is about identifying patterns and making predictions to help fulfill human needs. Whether that means improving public health, increasing the quality of customer experience, or driving technological innovation, the value of a model will ultimately be measured by its ability to make a difference in the real world. Tools like R-squared and adjusted R-squared are instruments that make this happen but are not ends unto themselves.
The human element of data analysis will be asking the right questions, interpreting results with humility, and communicating findings in ways that drive meaningful action. These skills cannot be reduced to metrics or automated processes but require judgment, creativity, and empathy. As analysts, we should remember that our work serves a greater purpose: solving problems, creating value, and making the world a better place.
Data Science: Getting Ready for the Future
As the practice of data science progresses, so will the means to judge models. For example, algorithms for machine learning often require measures of accuracy, precision, recall, and F1 scores that extend well beyond the scope of traditional regression analysis. Still, the principles of R-squared and adjusted R-squared live on.
In particular, the emphasis on balance-between simplicity and complexity, fit and generalizability-will always be the hallmarks of successful analysis.
Even as new methods continue to emerge, lessons of these foundational metrics will guide analysts in building models that are at the same time robust and interpretable.
Best Practices for Using R-squared and Adjusted R-squared
Below is one example of best practices relating to metric maximization:
• Align metrics with objectives. This choice of metrics depends on the objectives for your analysis. If interpretability and parsimony are critical, then adjusted R-squared should rank higher than R-squared.
• Validate with External Data. Inevitably, test out your model on unseen data to verify its potential for generalization. An R-squared or adjusted R-squared value is meaningless over training data when your model fails application in the real world.
•Multiple Metrics Integrated: Use R-squared and adjusted R-squared in combination with a few other evaluation criteria like RMSE or MAE so that the assessment would look more holistic.
• Articulate Simply: Explain to stakeholders about what the findings mean in terms related to them and not a lot of technical jargons. Make what this means for the problem and talk about it in relation to humans.
A call for analytical excellence
R-squared and adjusted R-squared are not just statistics; they are instruments towards achieving analytical excellence. Once one learns how to work with these metrics, it is actually they that enable analysts to be sure their models are accurate and meaningful as well as actionable. The difference in the world that is data-driven decisions.
And so, as you continue to progress through regression analysis and predictive modeling, do remember that the game here is not about obtaining a maximally possible R-squared or adjusted R-squared value. Rather, the objective in the process here is to derive models that serve the intent and are of utility toward unearthing truths, decision making, and other purposes.
Conclusion
- machine learning Precision and recall provide several advantages over other metrics (such as accuracy) in scenarios where class imbalance is an issue or when the cost of false positives and false negatives differs significantly. They are intuitive, flexible, and provide deep insights into model performance, particularly for high-stakes applications where every prediction matters. These metrics also allow for customizable tuning, making them highly adaptable to various industries and use cases.By providing a flexible trade-off, precision and recall allow machine learning practitioners to tailor their models to specific problem requirements—whether minimizing false alarms or ensuring all relevant instances are identified. The combined use of precision-recall curves and the F1-score further enhances their utility, enabling the balancing of these metrics for a more holistic view of model performance.
- Ultimately, the use of precision and recall ensures that machine learning models are evaluated and optimized with deeper context and relevance to the problem at hand. This makes them critical tools for building reliable, application-specific models that can meet real-world needs in a wide variety of industries.
- Indeed, these remain of prime importance in statistics in order to testify to continued relevance for data analysis. The two measures are ideals of simplicity and rigor as part of making a right, effective data-driven decision. It is only if they understand the subtlety involved in the metrics applied, thoughtfully, in this manner and incorporated within an expanded evaluation framework, can the full potential of data be unlocked.
- Master these metrics to navigate the complexities of modern data analysis, be you seasoned and a data scientist, analytics business analyst, or just research. It makes you work your way to constructing models fitting, not only into the information but also in a direction allowing meaningful insights in the processes, driving advancements in related spheres.
- In embracing the lessons of R-squared and adjusted R-squared, we become not only better analysts but also better stewards of the data-driven future. Pushing further the boundaries of what is possible with data, timeless metrics remind us of the principles of clarity, simplicity, and integrity. They will forever be cornerstones of analytical excellence.
2 thoughts on “Machine Learning-Adusted R-squared and R-squared”